WV Broadband Geospatial Analysis
Geospatial modeling, predictive analytics, and equitable bidding design for the $1.2B BEAD program
Overview
West Virginia is one of the least connected states in the United States, with steep Appalachian mountains, dispersed rural populations, and communities cut off by terrain. These barriers make deploying broadband uniquely difficult — it’s not just a question of where people live, but how accessible those places are.
As a Research Assistant with the WV State Office of Broadband, I was tasked with helping solve this challenge through data, modeling, and visualization. The work became part of the $1.2B Broadband Equity, Access, and Deployment (BEAD) program, directly informing how the state planned to expand high-speed internet to hundreds of thousands of residents.
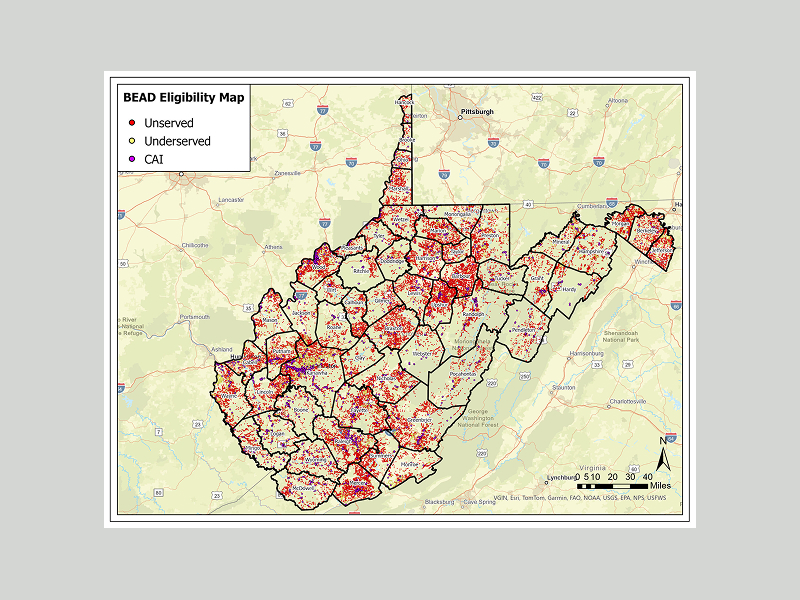
Our outputs were published in the Initial Proposal Volume 1, shaping one of the most consequential infrastructure investments in West Virginia’s history.
Key Contributions
- Census Data Automation: Built Python scripts to fetch, clean, and normalize demographic and broadband availability data from the Census API.
- Cross-Language Integration: Converted R workflows into robust Python pipelines with GeoPandas and SciPy, improving scalability for county-level analysis.
- Interactive Dashboards: Designed dashboards to help policymakers see where broadband gaps existed and prioritize underserved MSAs.
- Fair Bidding Model: Helped design a system that bundled profitable MSAs with less desirable rural ones, ensuring providers committed to the entire state instead of cherry-picking easy wins.
- Publication-Ready Visualizations: Delivered outputs that were included in the state’s official broadband proposal — consumed not only by policymakers but also federal reviewers.
Challenges & Solutions
1. Mountainous Geography
Traditional census classifications struggled in West Virginia because the terrain distorted “urban vs. rural” metrics. Communities five miles from a city might still be inaccessible due to mountain ranges.
- Solution: Crafted a drive-time heuristic based on minutes from interstate exits. This reframed “accessibility” in a way that reflected lived reality, producing more accurate rural classifications.
2. Equitable Distribution of Broadband
Providers often cherry-pick profitable areas, leaving remote communities behind.
- Solution: Designed a packaged bidding process pairing underserved MSAs with more profitable ones. This structure forced providers to think beyond short-term ROI and commit to holistic state coverage.
3. Multi-Source Data Integration
FCC maps, Census data, and provider-reported coverage were riddled with inconsistencies.
- Solution: Built harmonized workflows in Python + GeoPandas + SciPy, creating unified datasets that could withstand scrutiny and support policy-grade decisions.
Technical Implementation
- Python: Automated Census API pipelines, geospatial processing, and harmonization workflows.
- R (tidyverse, ggplot2): Initial analysis, exploratory data visualization, and statistical modeling.
- GeoPandas & SciPy: Spatial joins, accessibility heuristics, and testing of rural classification formulas.
- PyTorch & TensorFlow: Experimented with predictive models for broadband adoption and demand forecasting, simulating provider behaviors and long-term sustainability.
- Dashboards: Delivered county-level geospatial dashboards integrating maps, statistical summaries, and scenario testing — tools that decision-makers could actually use.
Results & Impact
- $1.2B in Funding: Analysis informed state decisions on how to deploy one of the largest federal investments in WV’s history.
- Publication: Contributed directly to WV Initial Proposal Volume 1, now part of the public record.
- Equitable Bidding Design: Prevented cherry-picking by creating fairer bidding packages, protecting rural communities.
- Reusable Frameworks: Created scalable pipelines that could be reused by other states tackling similar broadband equity issues.
- Professional Growth: Project strengthened my data engineering and visualization skills, helping me complete the IBM Data Analytics Professional Certificate.
Reflections
This project was more than an academic exercise — it was a live test of how data can shape equity. Numbers alone couldn’t solve the digital divide. What mattered was translating those numbers into policy structures that nudged providers toward fairness.
By blending technical analysis with human-centered design, I learned how to:
- Build models that respect geography and accessibility, not just census categories.
- Create visualizations that tell a story policymakers can act on.
- Balance the economics of providers with the social mission of digital equity.
In the end, this work was about more than broadband — it was about creating a roadmap for inclusion and opportunity.
Resources & Links
Research Paper
West Virginia Initial Proposal Volume 1
State-level proposal for the BEAD program. I supported the visualizations and modeling used in the final published report.
View PaperGallery
Geospatial visual broadband service gaps